Corundum Visible Spectra (generally 350 - 1200 nm)
Corundum occurs in several colored varieties. Ruby is red because of
its
Cr3+ content. Yellow sapphire usually owes its color to O- ions (hole centers) alone or interacting with Fe3+.
Blue sapphire derives its color from the Fe2+ -
Ti4+
and the Fe2+ - Fe3+
intervalance charge transfer.
Green sapphires contain a mixture of the blue and green
colors.
Images of representative corundums
-
Ruby GRR 1843;
Ruby obtained in Chathaburi, Thailand, 0.787 mm thick, looking down the
c-axis. All the features are from Cr3+ including
the sharp spin-forbidden
band near 695 nm. Data files: a;
-
Ruby
GRR 1843; Ruby obtained in Chathaburi, Thailand, 0.758 mm
thick, looking down the
c-axis. Spectra as a function of temperature (27, 300 and 600 C). Data
files: 27 degrees;,
300 degrees;,
600 degrees;
-
Ruby
GRR 1843 animation;
A movie showing the change of color of ruby 1843 as a function of
temperature: 0.758 mm thick, looking down the c-axis (795 KB).
-
Sapphire
GRR 1020 (6K); Medium
blue sapphire
 from an unknown locality (probably in Australia) presented
normalized to 3.00 mm thick. All the sharp features are from Fe3+
and the broad features which dominate the spectrum are from
intervalence
charge transfer between Fe2+ and Ti4+
and between
Fe2+ and Fe3+. Data
files: a; c,
-
Sapphire
GRR 1798 (6K); Pale
blue sapphire
 from the Missouri River near Helena, Montana, 3.23
mm thick, looking down the c-axis. All the sharp features are from Fe3+
and the weak, broad features are from intervalence charge transfer
between
Fe2+, Fe3+ and Ti4+.
Data files: a;
- Sapphire
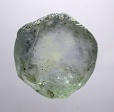
GRR 1930-2. pale greenish-yellow sapphire
 from
Rock Creek, Montana, 4.35 mm thick.
- Sapphire
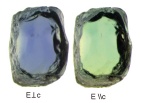
GRR 1930-5; light greenish-blue sapphire
 from
Rock Creek, Montana, 4.80 mm thick, with distict dichroism.
- Corundum GRR 3614; violet crystal
 , from Colombia, 6.26 mm thick. Data files: a; c.
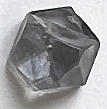
- Corundum, GRR 3615; blue crystal
 , from Colombia, 4.44 mm thick, Data files; a; c.
-
Picture of a zoned
sapphire crystal
from Laos with clickable
spectra in different
zones.
High-Quality Absolute Intensity Graphs - Contributed data from John Emmett.
 Back
to the list of minerals
 Back
to the Index of Data Files
 Back
to the
Mineral Spectroscopy home page
revised
3-Jul-2022
 from an unknown locality (probably in Australia) presented
normalized to 3.00 mm thick. All the sharp features are from Fe3+
and the broad features which dominate the spectrum are from
intervalence
charge transfer between Fe2+ and Ti4+
and between
Fe2+ and Fe3+. Data
files: a; c,
 from the Missouri River near Helena, Montana, 3.23
mm thick, looking down the c-axis. All the sharp features are from Fe3+
and the weak, broad features are from intervalence charge transfer
between
Fe2+, Fe3+ and Ti4+.
Data files: a;
 from
Rock Creek, Montana, 4.35 mm thick.
 from
Rock Creek, Montana, 4.80 mm thick, with distict dichroism.
  , from Colombia, 6.26 mm thick. Data files: a; c.
 , from Colombia, 4.44 mm thick, Data files; a; c.


