Estimated optical
constants of Gypsum in the regions of weak
absorptions:
Application of
scattering
theories and comparisons to independent measurements
Ted L. Roush
NASA
Ames Research Center, Astrobiology &
Space Sciences Division
Planetary
Systems Branch, MS 245-3, Moffett Field,
CA 94035-1000
Francesca Esposito
INAF, Osservatorio Astronomico di Capodimonte, Via
Moiariello 16, 80131, Napoli, Italy
George R. Rossman
Division of Geological and Planetary Sciences
Califorinia Institute of Technology, Pasadena, CA 91125-2500
Luigi Colangeli
INAF, Osservatorio Astronomico di Capodimonte, Via
Moiariello 16, 80131, Napoli, Italy
Abstract
Diffuse
reflectance spectra of multiple grain size
fractions are used to estimate the optical constants of gypsum over the
0.4-15 mm
wavelength region. Two
independent
scattering theories are used to iteratively determine the imaginary
index of
refraction from the measured reflectance.
We compare the results of these two with each other, and
with imaginary
indices of gypsum reported in the literature.
We find that the scattering theory results are more
sensitive in the
infrared to weak spectral features that are clearly distinguished in
the
diffuse reflectance spectra. However,
we find the scattering results provide a poor determination of the
optical
constants in the regions of relatively strong absorptions. At visible and
near-infrared wavelengths we
provide a comparison to the results obtained from analysis of the
diffuse
reflectance to results obtained from direct transmission measurements
of gypsum
crystals. We find
the imaginary index
of refraction determined from scattering theories is systematically
less than
that obtained from transmission spectra, especially for regions of weak
absorption. We
attribute this
discrepancy to potential scattering that occurs within the crystals
during the
transmission measurements. We
combine
the resulting real and imaginary indices of refraction with those
reported at
infrared wavelengths to provide values covering visual, near-, and
infrared
wavelengths (0.4-333 mm,
25000-30 cm-1).
Gypsum
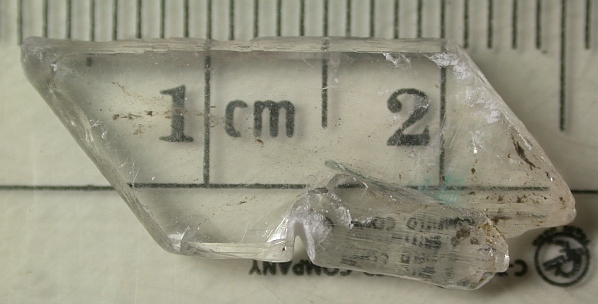
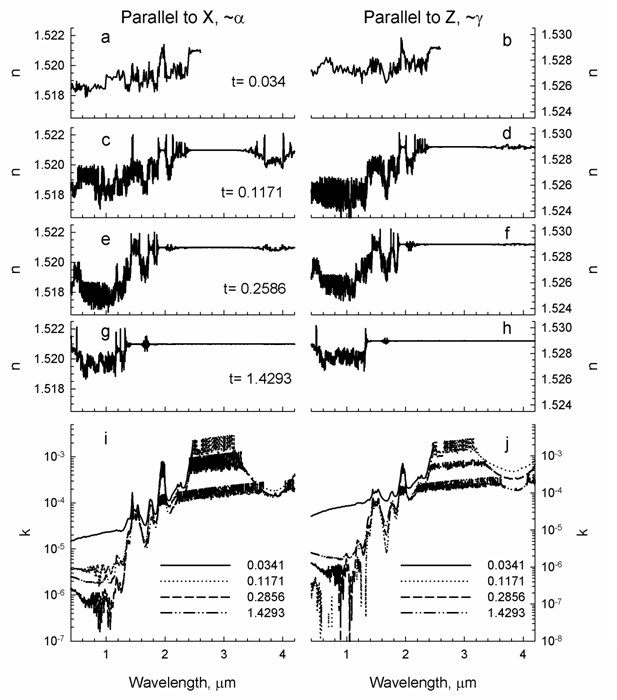
crystal 2.856 mm thick from Brookville, Saline County, Kansas
Data from the Paper
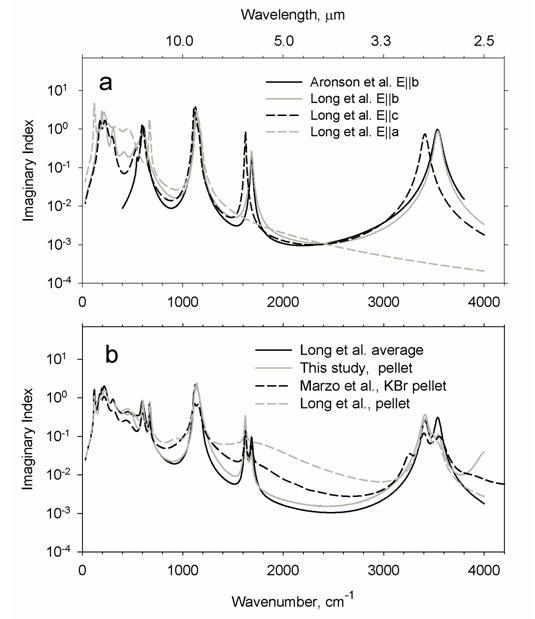
Figure
1, Imaginary
Indices of Refraction
Click to Save
Figure
3, Specular
Reflectance of Gypsum
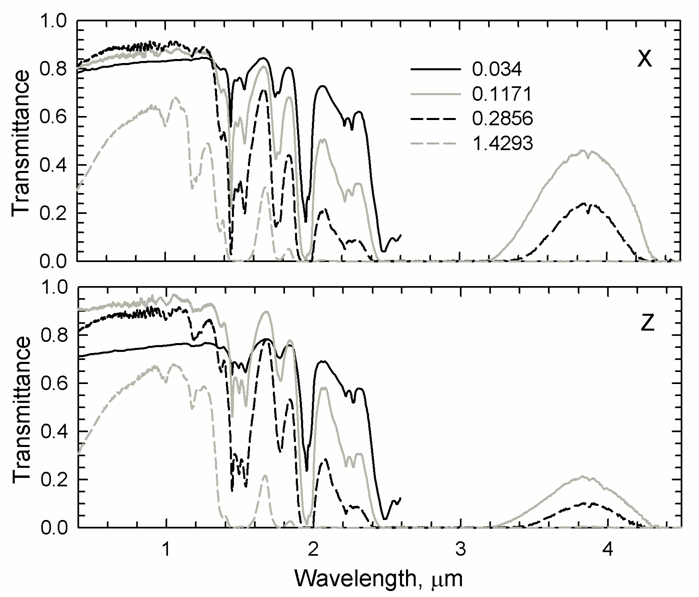
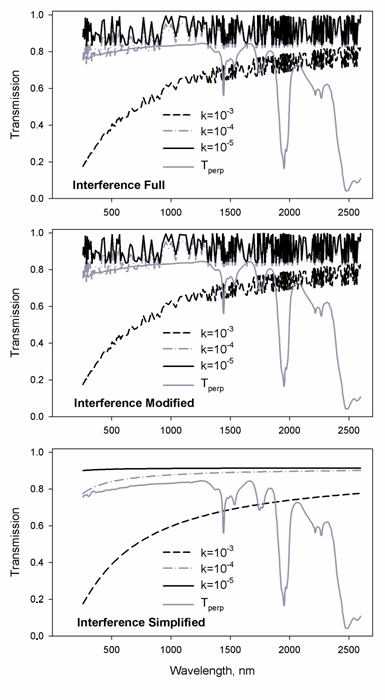
Figure 4, Transmission Spectra of Four Gypsum Crystals
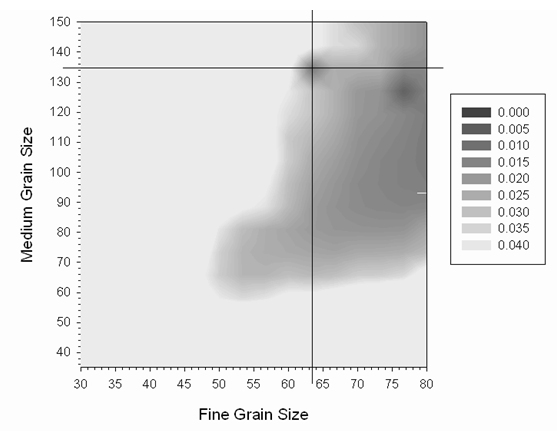
Figure 5, Contour Plot
| Shaded
Countour Plot |
Data
|
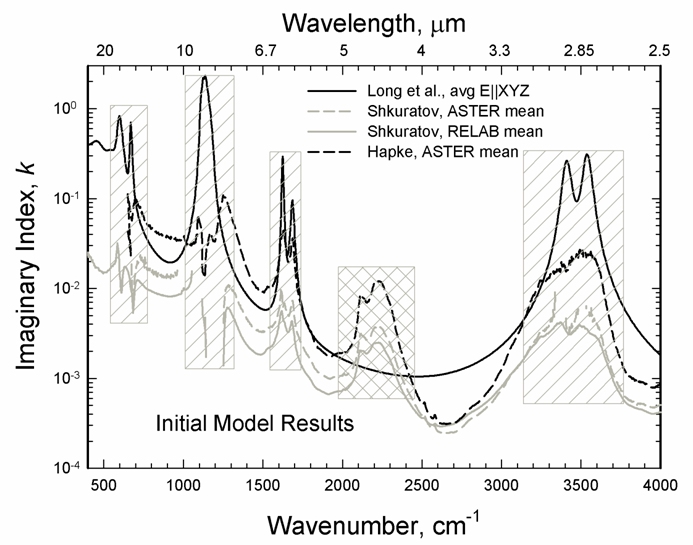
Figure 6, Calculated Single Scattering Albedo Values
Figure 7, Comparison of
k-values
| Hapke
[1993] ASTER data |
Data
|
| Shkuratov
et al. [1999] ASTER data |
Data
|
| Shkuratov
et al. [1999] RELAB data |
Data
|
| Long
et al [1993] average values |
Data
|
Figure 8,
k-values
| Shkuratov
et al. [1999] ASTER |
Data
|
| Shkuratov
et al. [1999] RELAB |
Data
|
| Long
et al. [1993] average |
Data |
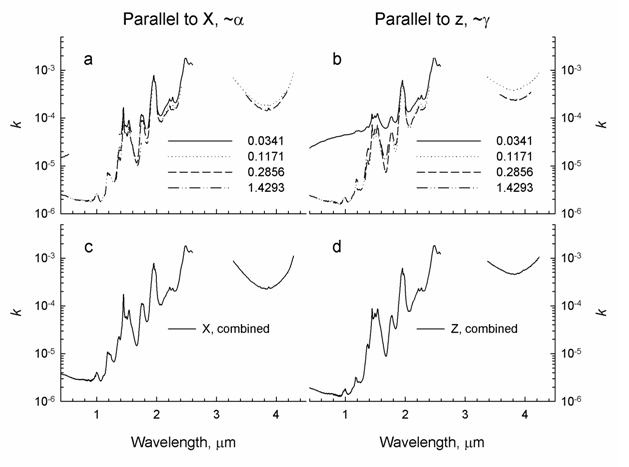
Figure 9, Transmission Spectra of (010) face
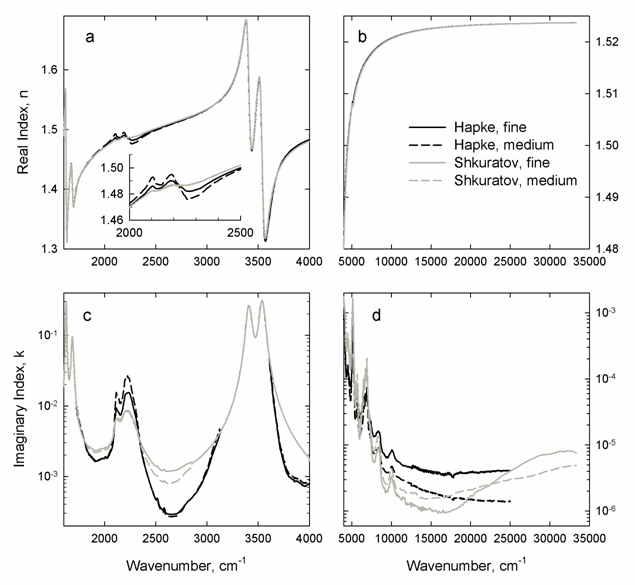
Figure 10, Optical Constants of Gypsum Samples
| 0.0341
cm, E \\X = ~alpha |
Data
a |
| 0.0341
cm, E \\Z = ~ gamma |
Data
b |
| 0.1171
cm, E \\X = ~alpha |
Data
c |
| 0.1171
cm, E \\Z = ~ gamma |
Data
d |
| 0.2856
cm, E \\X = ~alpha |
Data
e |
| 0.2856
cm, E \\Z = ~ gamma |
Data
f |
| 1.1493
cm, E \\X = ~alpha |
Data
g |
| 1.1493
cm, E \\Z = ~ gamma |
Data h |
| Derived
imaginary index, E \\X = ~alpha |
see files a-h |
| Derived
imaginary index, E \\Z = ~ gamma |
see files a-h
|
Figure 11,
Derived
Imaginary Indices
| 0.0341
cm, E \\X = ~alpha |
Data |
| 0.0341
cm, E \\Z = ~ gamma |
Data |
| 0.1171
cm, E \\X = ~alpha |
Data |
| 0.1171cm,
E \\Z = ~ gamma |
Data |
| 0.2856
cm, E \\X = ~alpha |
Data |
| 0.2856
cm, E \\Z = ~ gamma |
Data |
| 1.1439
cm, E \\X = ~alpha |
Data |
| 1.1493
cm, E \\Z = ~ gamma |
Data |
| Combined
imaginary index, E \\X = ~alpha |
Data
|
| Combined
imaginary index, E \\Z = ~ gamma |
Data |
Figure 12, Theoretical
values
| n-values
Infrared |
Data
|
| n-values
Vis-NIR |
Data
|
| k-values
Infrared |
Data
|
| k-values
VIS-NIR |
Data
|
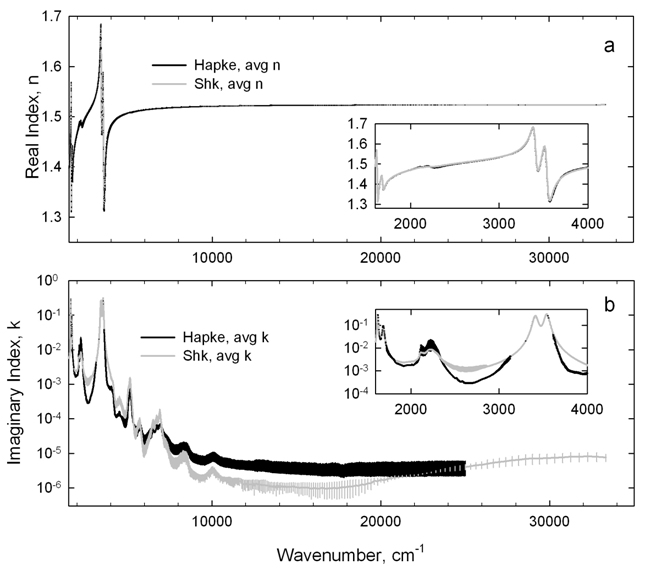
Figure 13, Average n-values
Figure 14, Average n-values
| Average
of all theory |
Data |
Figure 15, Data Comparisons
| Imaginary
Index, E\\X |
Data
|
| Imaginary
Index, E\\Z |
Data
|
| Transmission
average |
Data |
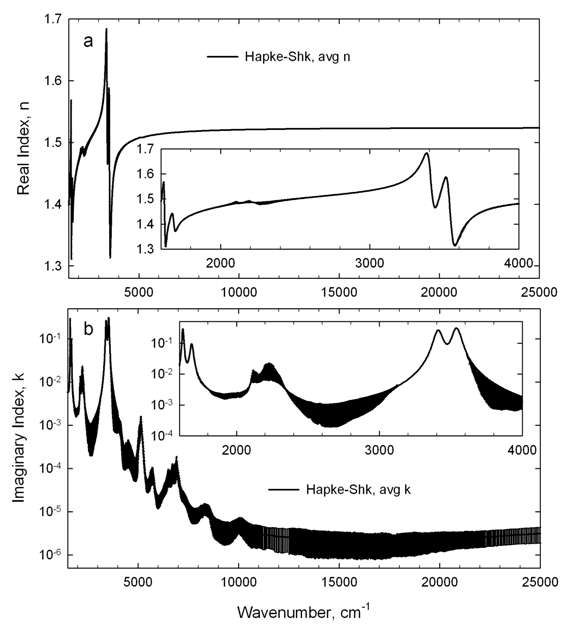
| Hapke-Shkuratov |
Data
|
| Sub-sampling
Transmission |
Data
|
| Sub-sampling
Hapke-Shkuratov |
Data
|
Journal of Geophysical Research 112